Impact on wetland from groundwater withdrawal

Objectives: Quantify the impact of groundwater pumping on drawdown near a wetland.
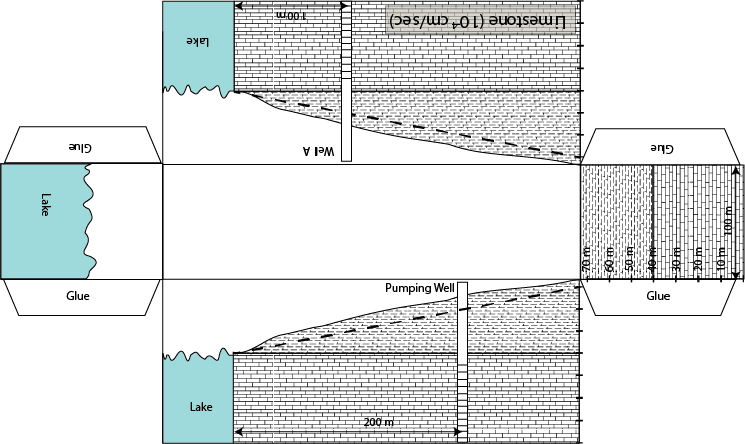
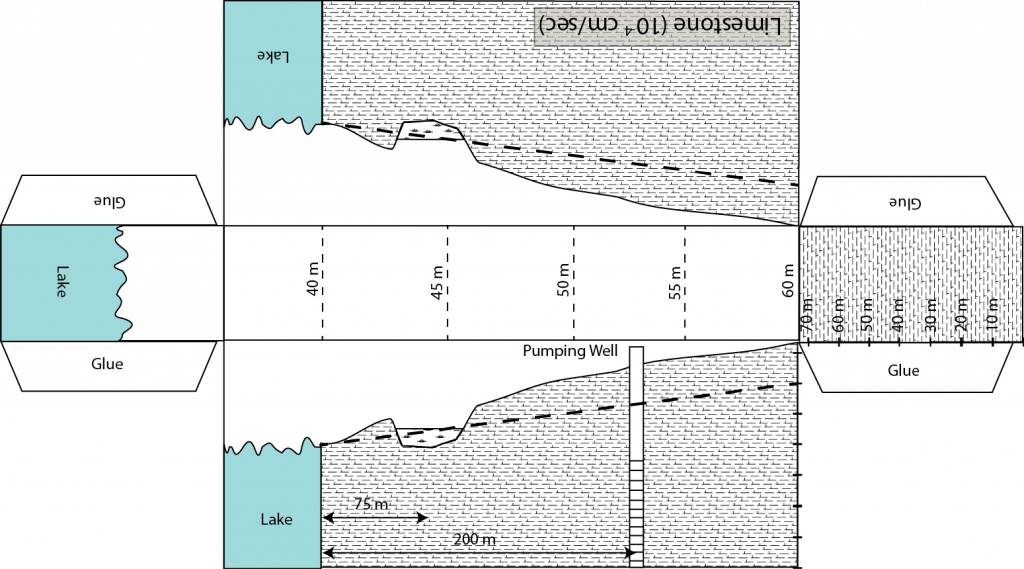
1. There are scenarios where water managers must balance the need for water supply against those of ecosystem services.  An example is the problem shown below where you are asked to install a pumping well to provide water for a community but at the same time there is a legal framework that prevents you from lowering the water table in a nearby wetland. 
Using the foldable aquifer models given below answer the following questions.

A. Without changing the level of the water table at the wetland determine the maximum pumping rate at the water supply well.  

B. If the lake were to be removed from this problem would your maximum pumping rate increase or decrease?  By how much?
Creative Commons License


This work is licensed under a Creative Commons Attribution-NonCommercial 4.0 International License.
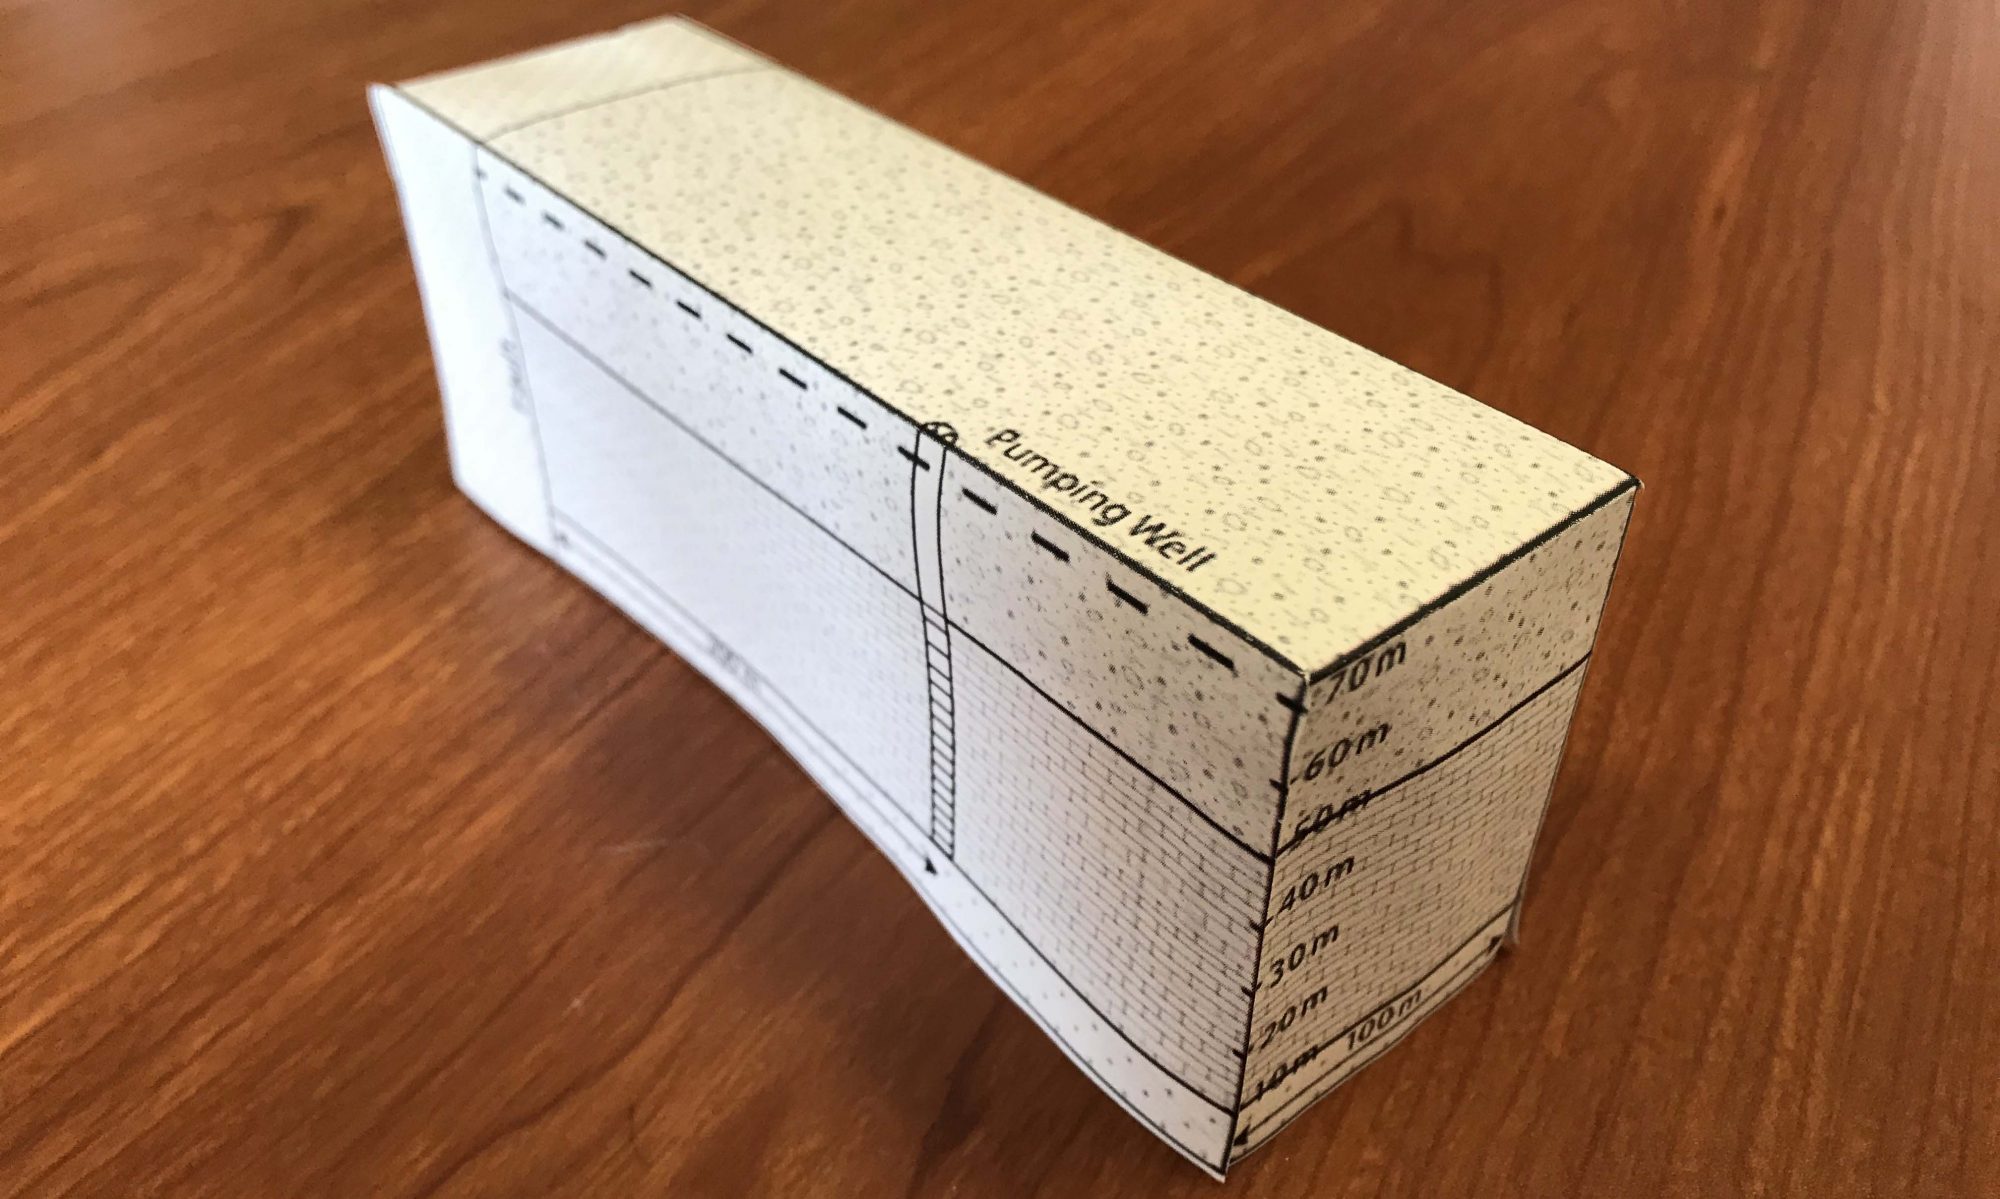
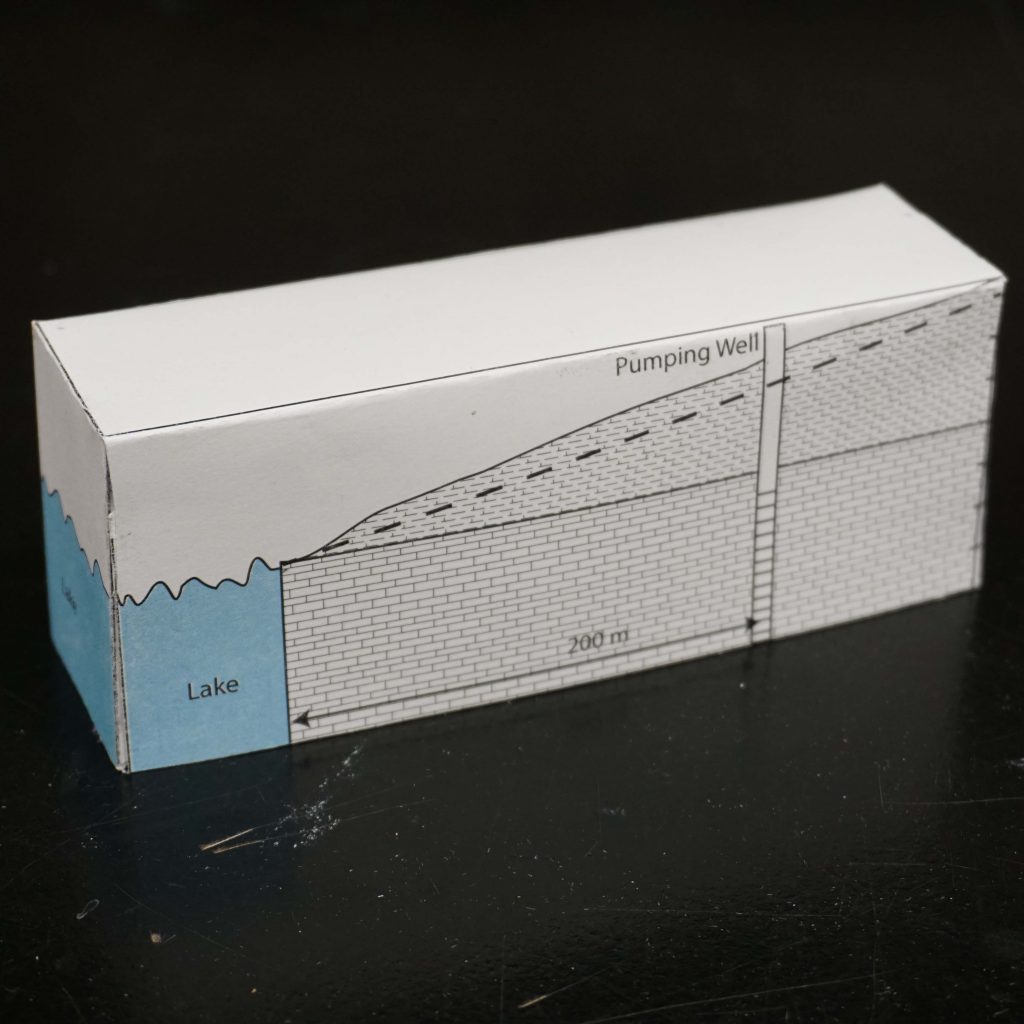
Image well and max pumping rate

Objectives: Determine the maximum pumping rate on a well possible without drawing water from a lake or wetland.
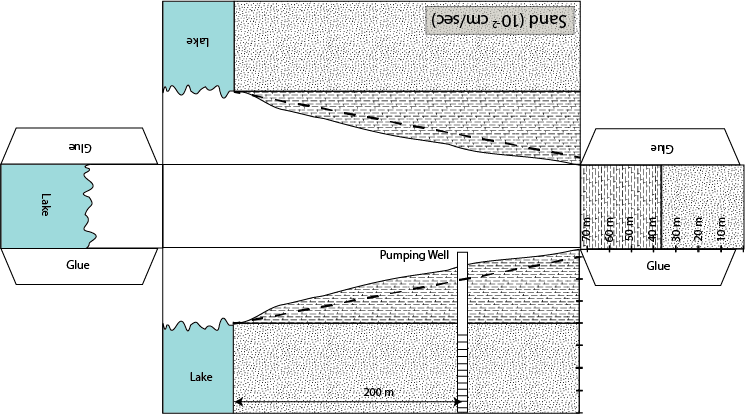
1. There are times that you need to determine the maximum pumping rate in a well that can be used without extracting water from a nearby lake or wetland.  This is a classic image well problem.  The foldable aquifer model that is provided in the problem below asks you to solve this exact style of problem.  Before pumping there is a gradient across the confined aquifer that shows water is flowing toward the lake.  Use the foldable aquifer model provided to answer the following question

A. Determine the maximum pumping rate at the well that is possible without drawing water from the lake.  

Creative Commons License


This work is licensed under a Creative Commons Attribution-NonCommercial 4.0 International License.
Pumping near a no flow boundary

Objectives: Determine the impact of a now flow boundary on groundwater pumping in a confined aquifer.
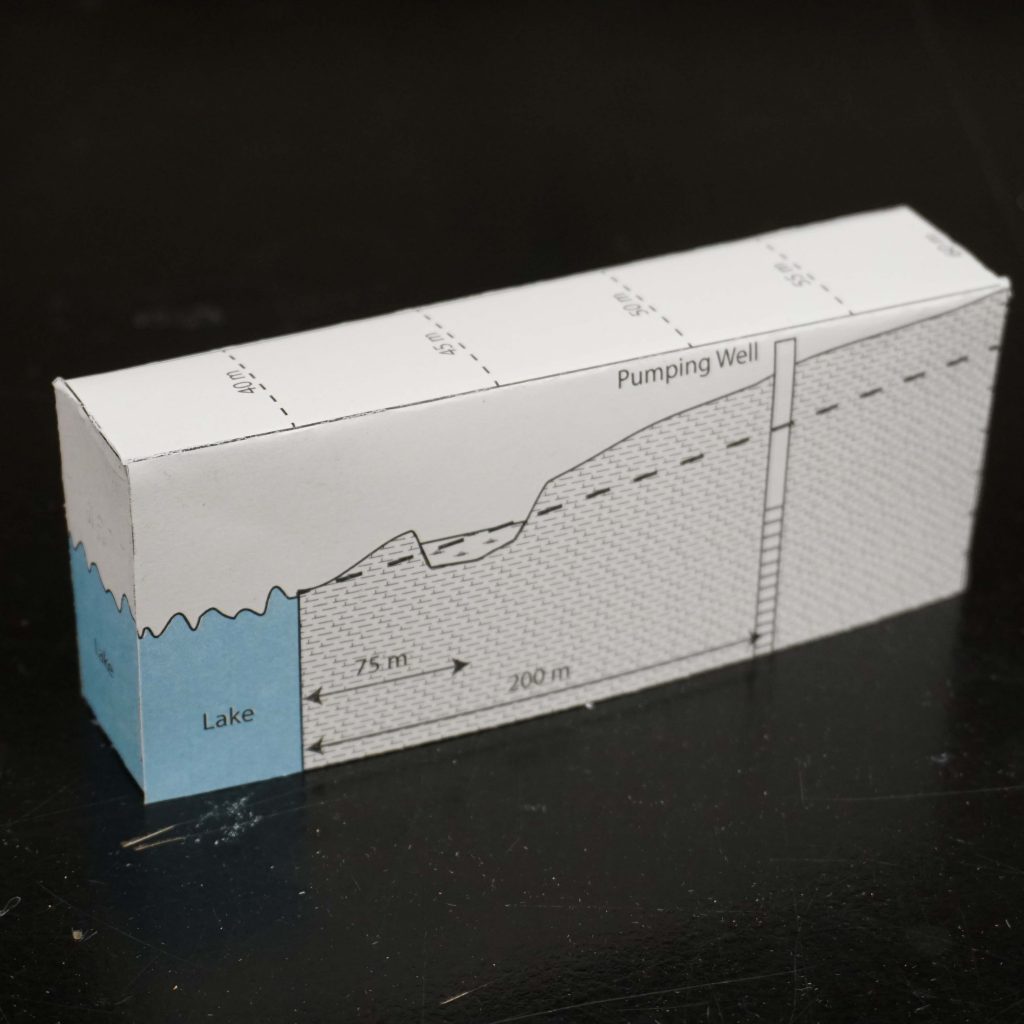
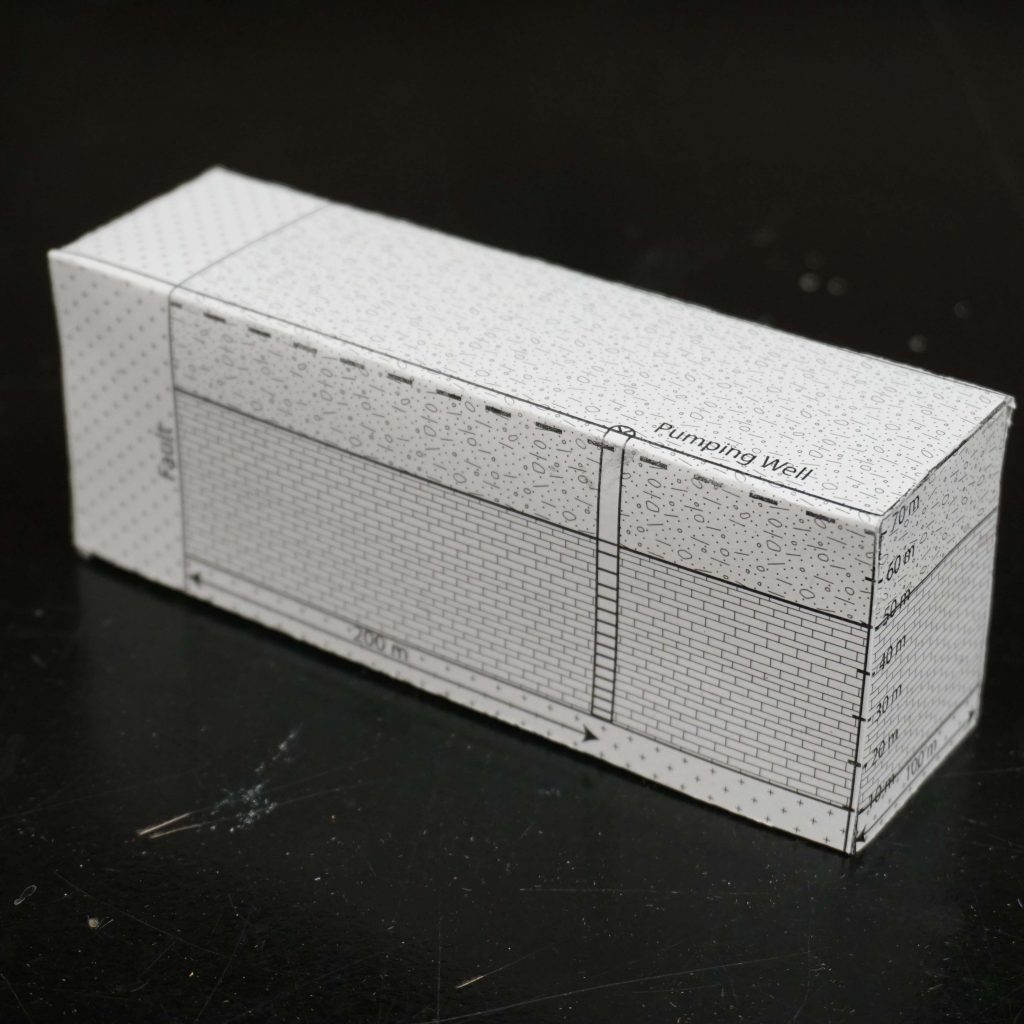
1. Groundwater drawdowns in wells can be impacted in aquifers that are adjacent to no flow boundaries, such as impermeable faults or even building foundations.  These no flow boundaries cause an asymmetry in the cone of depression.  In order to solve this style of problem, we can use image wells, which are imaginary wells that are added to the system to represent drawdown at the no flow boundary.  The foldable aquifer model that is provided in the problem below asks you to solve one of these drawdown problems, where the pumping well is adjacent a no flow boundary.  Before pumping there is no gradient across the confined aquifer as shown by the dashed line.  Use the foldable aquifer model provided to answer the following question

A. Determine the pumping rate at the well needed to cause the confined limestone aquifer to become unconfined adjacent to the fault.

B. Once the confined limestone aquifer becomes unconfined adjacent to the fault what is the direction of groundwater flow.  If you were to then turn the pumping well off how would this direction of groundwater flow change.

C. If the fault was replaced by a lake of infinite volume what would the pumping rate would be needed to cause the limestone aquifer to become unconfined. 

Creative Commons License


This work is licensed under a Creative Commons Attribution-NonCommercial 4.0 International License.
Pumping near a constant head boundary

Objectives: Quantify the drawdown in the potentiometric surface due to groundwater pumping near a constant head boundary.
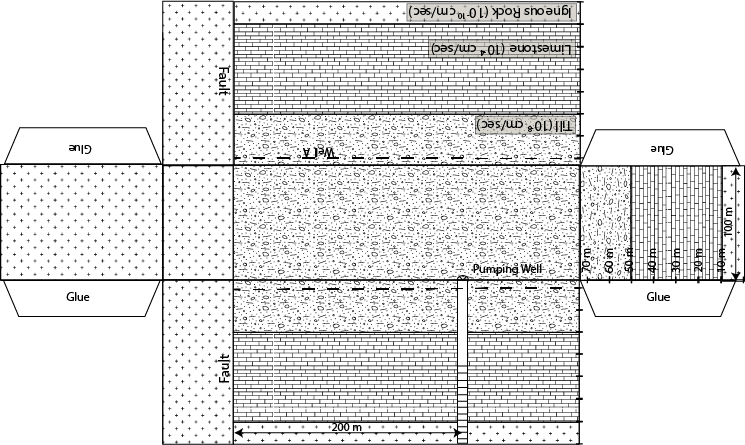
1. There are many cases in coastal aquifer where you must calculate groundwater drawdown near an infinite source of water (i.e. the ocean or large lake).  As a result of this configuration it is necessary to account for this boundary condition.  To do this we use a method of images where a ‘fake’ or image well is placed in the lake or ocean an equal distance between the pumping well and the boundary.  In the problem below, it is your job to determine the water level in well B due to pumping in the pumping well at a pumping rate of 200 m3/day (36.7 gal/min).  Note that before pumping there is a gradient across the confined aquifer that shows water is flowing toward the lake.  Use the foldable aquifer model provided to answer the following question

A. Draw in map view a diagram showing the position of the pumping well, observation well (well A) and image well.

B. Determine the water level in well A after pumping has reached steady state.

C. Explain how the results would change if there was no initial gradient in the potentiometric surface prior to pumping.  In your description please state where you would expect to see the water level in well A.  

Creative Commons License


This work is licensed under a Creative Commons Attribution-NonCommercial 4.0 International License.
Steady State Pumping: Thiem Equation

Objectives: Determine drawdown around a pumping well under steady state conditions.

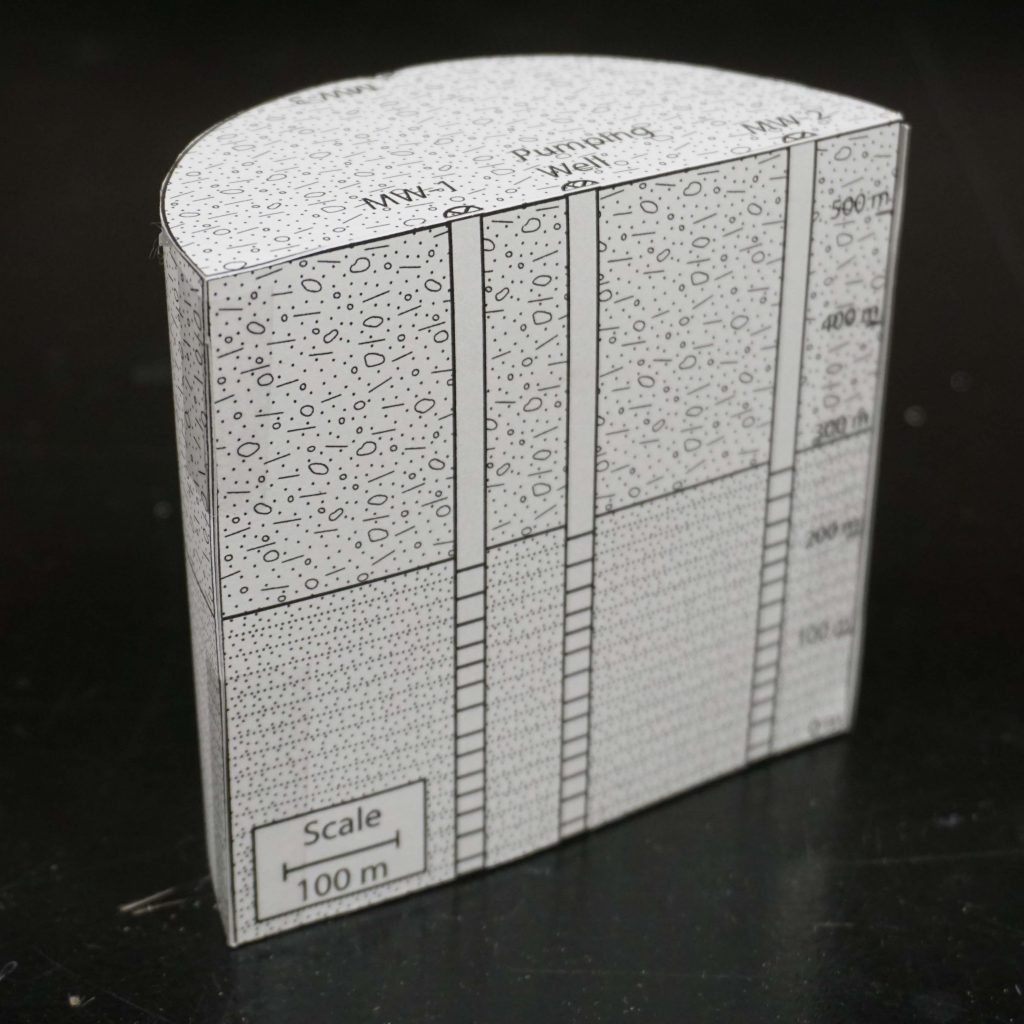
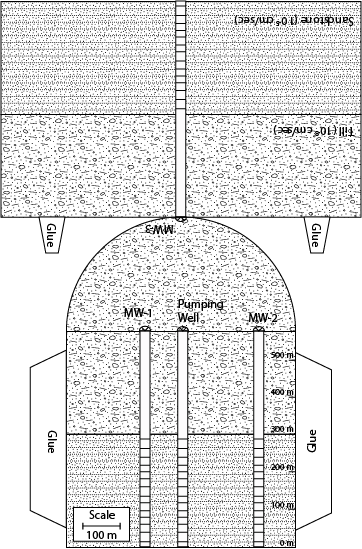
1. The following confined aquifer has four wells that fully penetrating the confined aquifer.  The center pumping well has been pumping at a constant rate of 400 m3/day for the last four years resulting in a steady state potentiometric surface.  The water level in MW-1 was measured at 350 meters above sea level.  Using the foldable aquifer answer the following questions:

A. Before making any sort of quantitative analysis explain the general trend in water levels between MW-1, MW-2 and MW-3. 

B.  Determine the water level in MW-2, MW-3.

C.  Describe how the cone of depression would change if the hydraulic conductivity changed to 102 cm/sec (Coarse Gravel) from 10-5 cm/sec (Sandstone).

Creative Commons License


This work is licensed under a Creative Commons Attribution-NonCommercial 4.0 International License.